Data Visualisation & Information Design
Turning complex research into visual insights
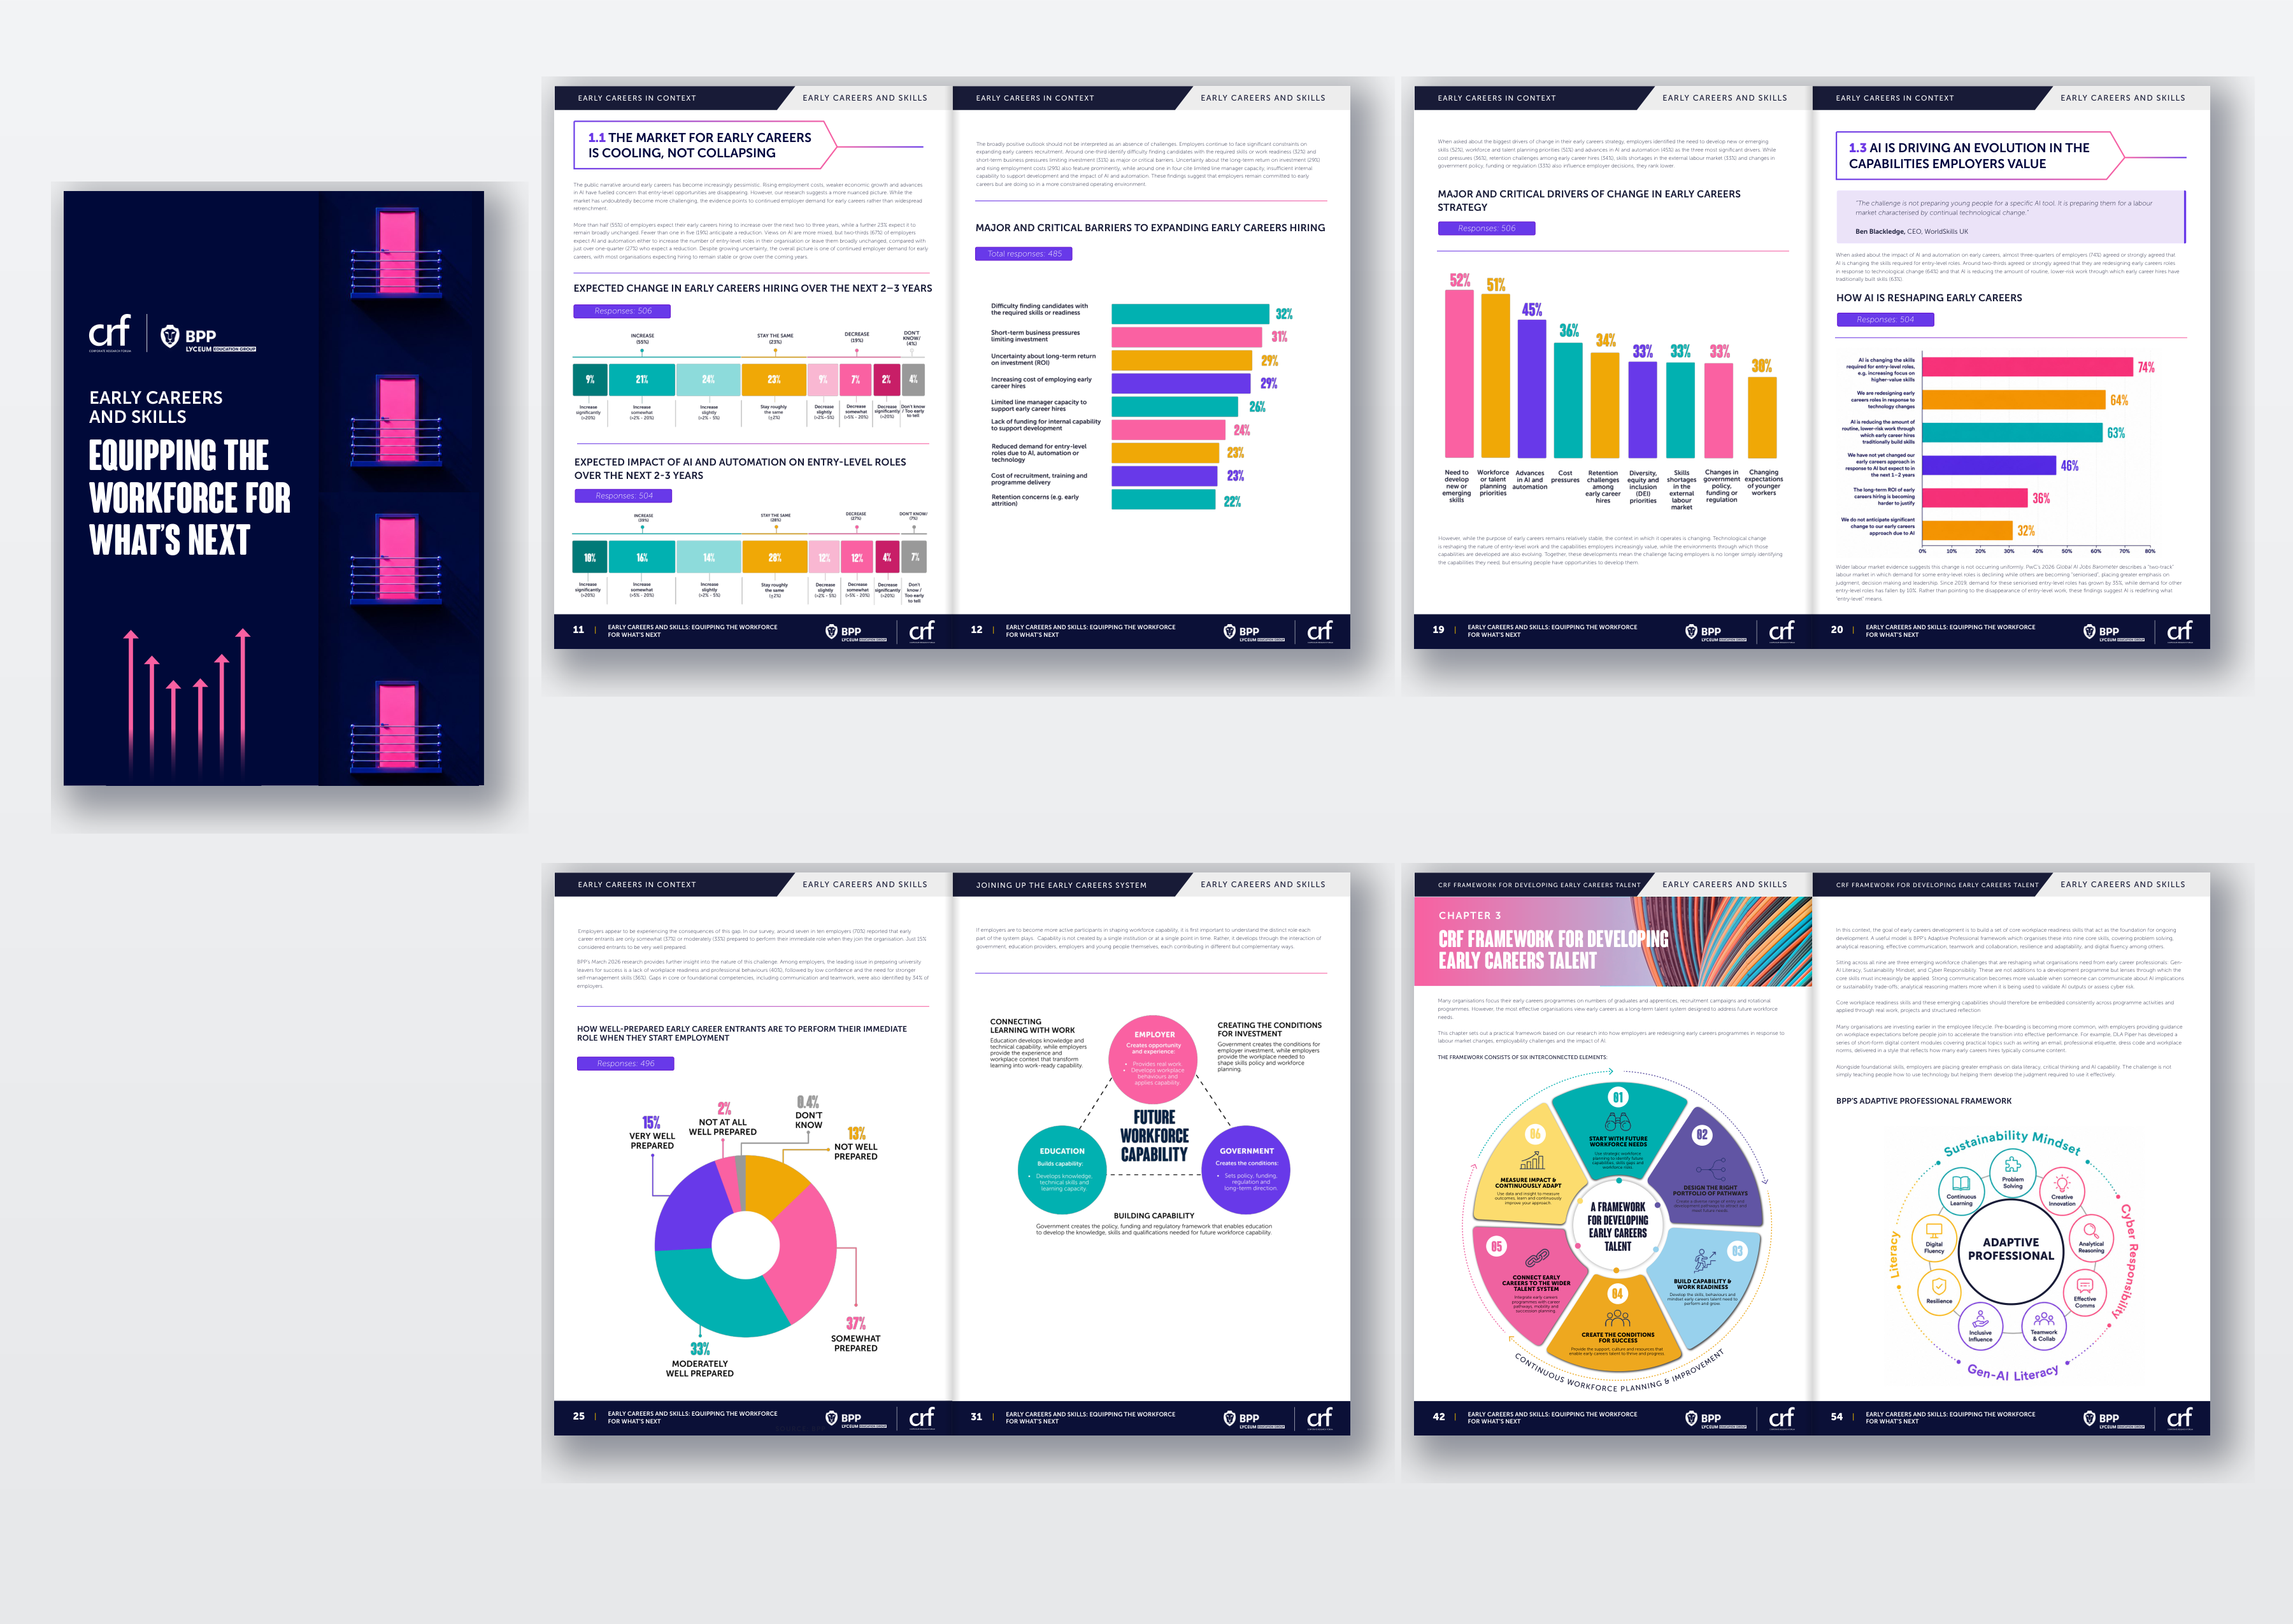
As part of CRF’s Early Careers & Skills: Equipping the Workforce for What’s Next research report, I developed a series of data visualisations and infographics designed to make complex workforce research clear, engaging and accessible.
The 66-page publication explored the changing landscape of early careers, including the impact of AI, workforce development, recruitment challenges and emerging skills.
My focus was on translating detailed research findings and statistical data into visually compelling, easy-to-understand graphics while maintaining consistency with CRF’s established brand identity.
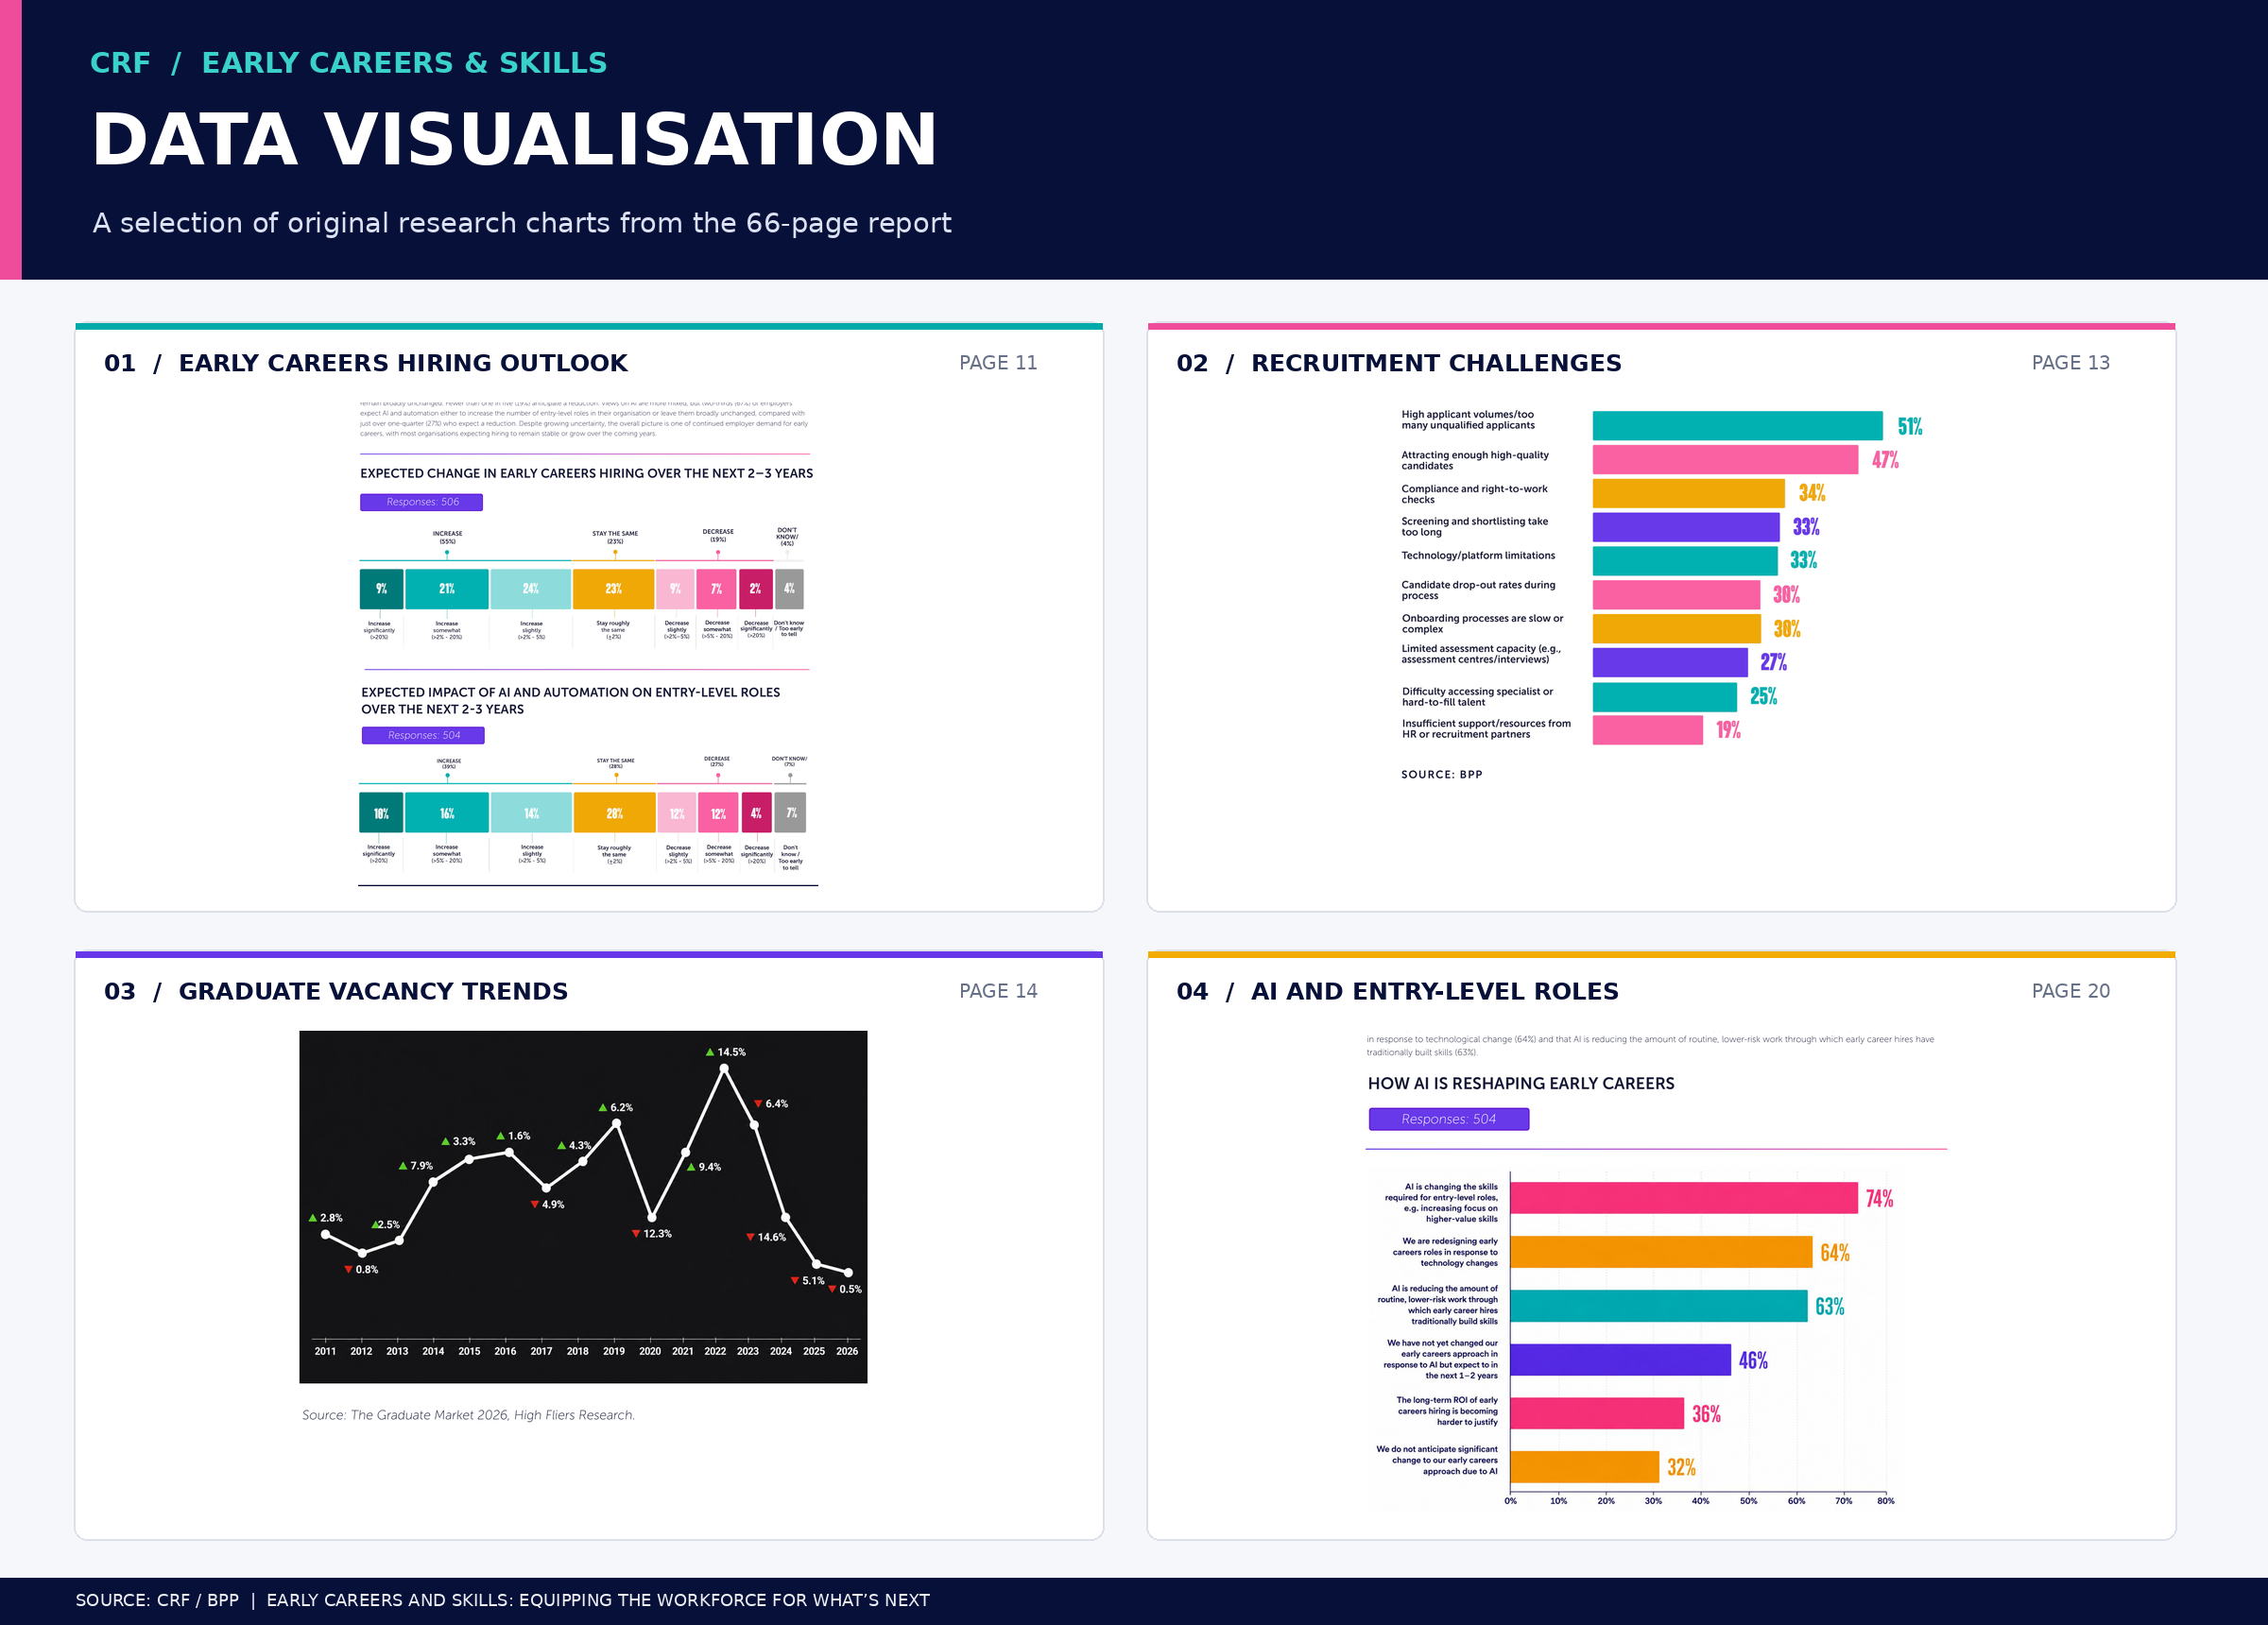
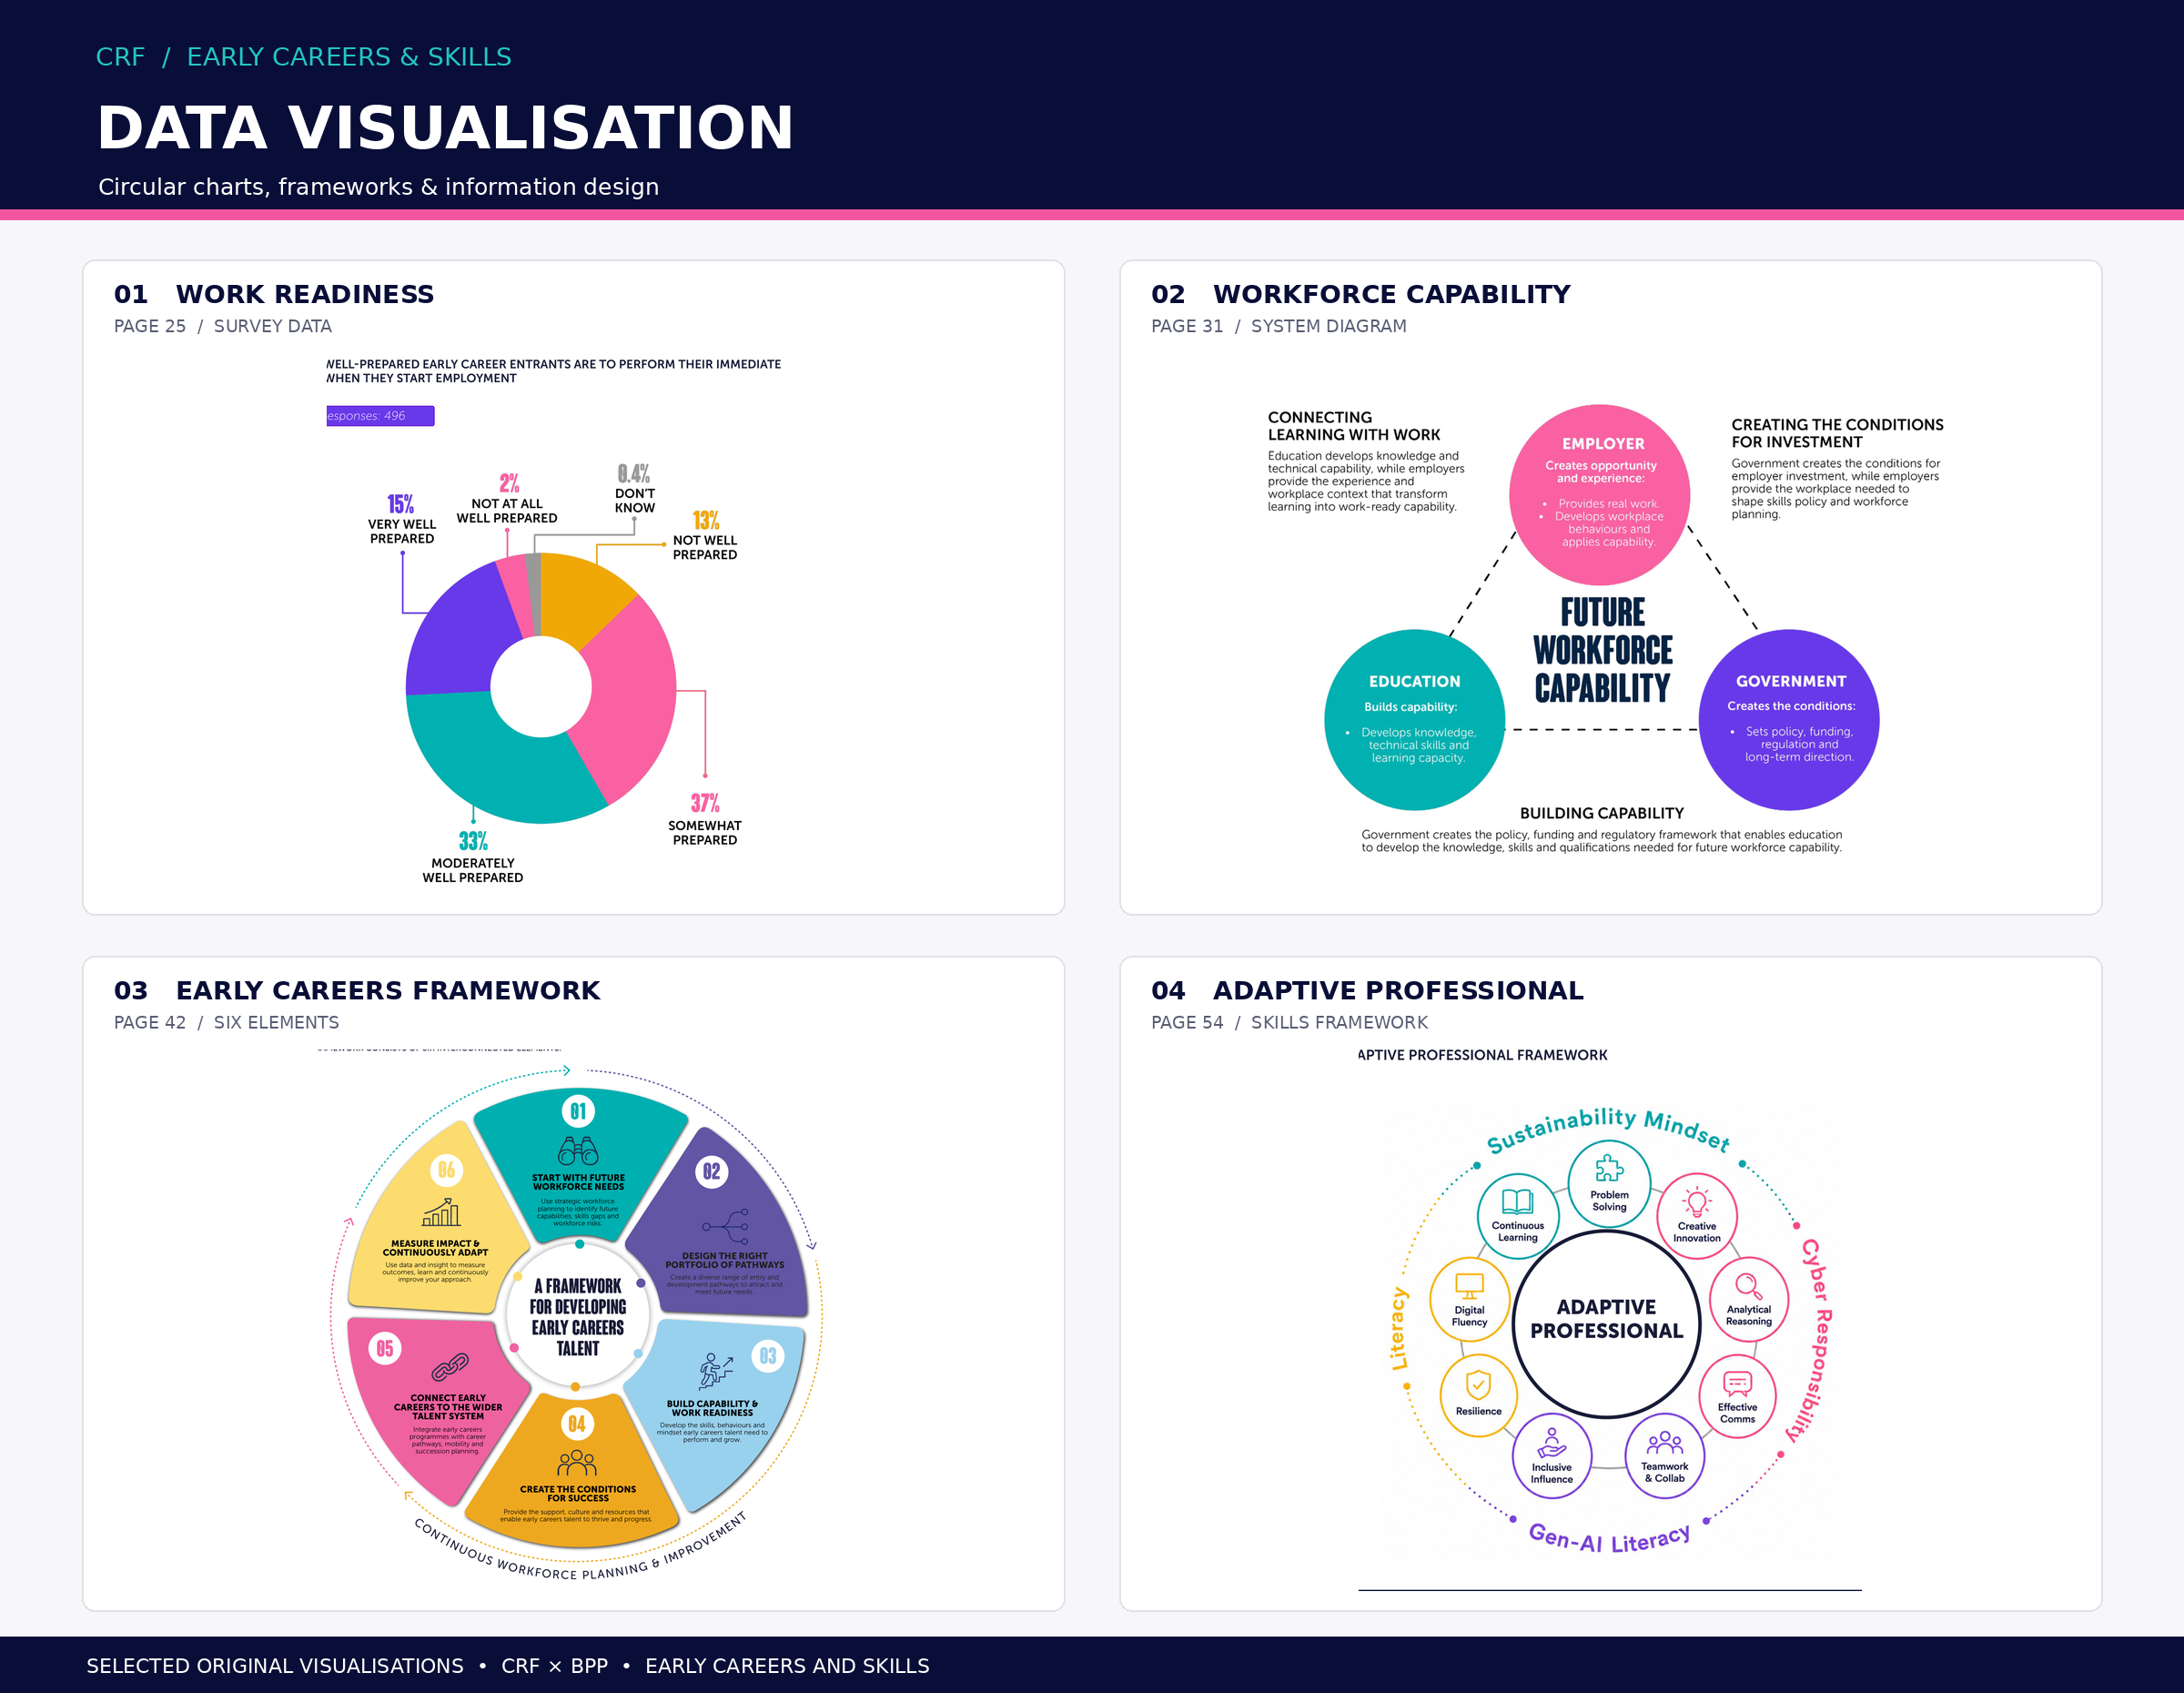
Using a combination of bar charts, segmented data visualisations, circular diagrams and conceptual frameworks, I created a cohesive visual language that balanced clarity with creative impact.
Bold typography, purposeful colour coding and structured layouts helped establish a clear information hierarchy, allowing readers to identify key findings and understand complex relationships at a glance.
The result was a visually consistent, research-led publication that communicated valuable insights to senior HR, talent and business leaders.
Key Skills: Data Visualisation · Information Design · Infographics · Editorial Design · Visual Storytelling · Brand Consistency
DOWNLOAD PDF